Scores
- 91,3 overall
- 100,0 ux
- 92,0 seo
- 97,0 privacy
- 91,5 security
- 76,0 performance
- 86,0 accessibility
- 96,7 best-practices
Changes since last run
Compared with the Aug 12, 15:35 run of the same URL.
- 0 fixed
- 16 new
- 18 persisting
⚠️ module sets differ between runs — "fixed"/"new" may just reflect coverage changes.
New (16)
- low Consent banner may lack a reject/manage option /
- high Reduce JavaScript execution time /
- medium Missing Content-Security-Policy /
- medium Total Blocking Time /
- low Missing Permissions-Policy /
- high Max Potential First Input Delay /
- info Detected: Server site-wide
- info No web app manifest /
- high Elements must meet minimum color contrast ratio thresholds /
- low Duplicate id attributes /
- medium Cookie missing HttpOnly flag(s) /
- low Cross-origin resources without SRI /
- high Issues were logged in the `Issues` panel in Chrome Devtools /
- high Links must be distinguishable without relying on color /
- info Detected: WordPress site-wide
- medium Speed Index /
Persisting (18)
- medium First Contentful Paint /
- medium Improve image delivery /
- high Time to Interactive /
- high Avoid multiple page redirects /
- medium Image elements do not have explicit `width` and `height` /
- medium Minify JavaScript /
- medium Legacy JavaScript /
- medium Reduce unused JavaScript /
- high Render-blocking requests /
- high Network dependency tree /
- high Links do not have descriptive text /
- high Background and foreground colors do not have a sufficient contrast ratio. /
- medium Minify CSS /
- high Minimize main-thread work /
- medium Reduce unused CSS /
- medium Use efficient cache lifetimes /
- high Document request latency /
- medium Largest Contentful Paint /
Delivery checklist 12/16 passed
Doois — Entrega de Projetos (Frontend)
| ✓ | Favicon instalado | |
|---|---|---|
| ✓ | Metatags (title, description, viewport) | |
| ✓ | Open Graph tags | |
| ✓ | Twitter Cards | |
| ! | Assinatura no rodapé (link doo.is + utm) | link doo.is presente mas sem o utm de assinatura |
| ✓ | Sem placeholders (lorem ipsum / imagens aleatórias) | |
| ✓ | Sem links quebrados | |
| ✓ | Layout responsivo (sem overflow horizontal) | |
| ! | Performance (Lighthouse) próxima de 100 | score=76.0 |
| ✕ | Analytics instalado | Server, WordPress |
| ✕ | Sentry / monitoramento de erros | |
| ✓ | robots.txt + sitemap presentes | robots=True sitemap=True |
| — | Domínio de produção configurado | defina config.expected_domain para verificar |
| ✓ | Página 404 retorna 404 (estilo avaliado pelo revisor AI) | status ok |
| ✓ | Mecanismo de consentimento de cookies | |
| ✓ | Link para política de privacidade | |
| ✓ | Sem rastreio antes do consentimento |
Findings 34
Site-wide
| Severity | Module | Finding | Recommendation |
|---|---|---|---|
| info | tech | Detected: Server Server — cloudflare |
|
| info | tech | Detected: WordPress WordPress — detected |
Pages 1
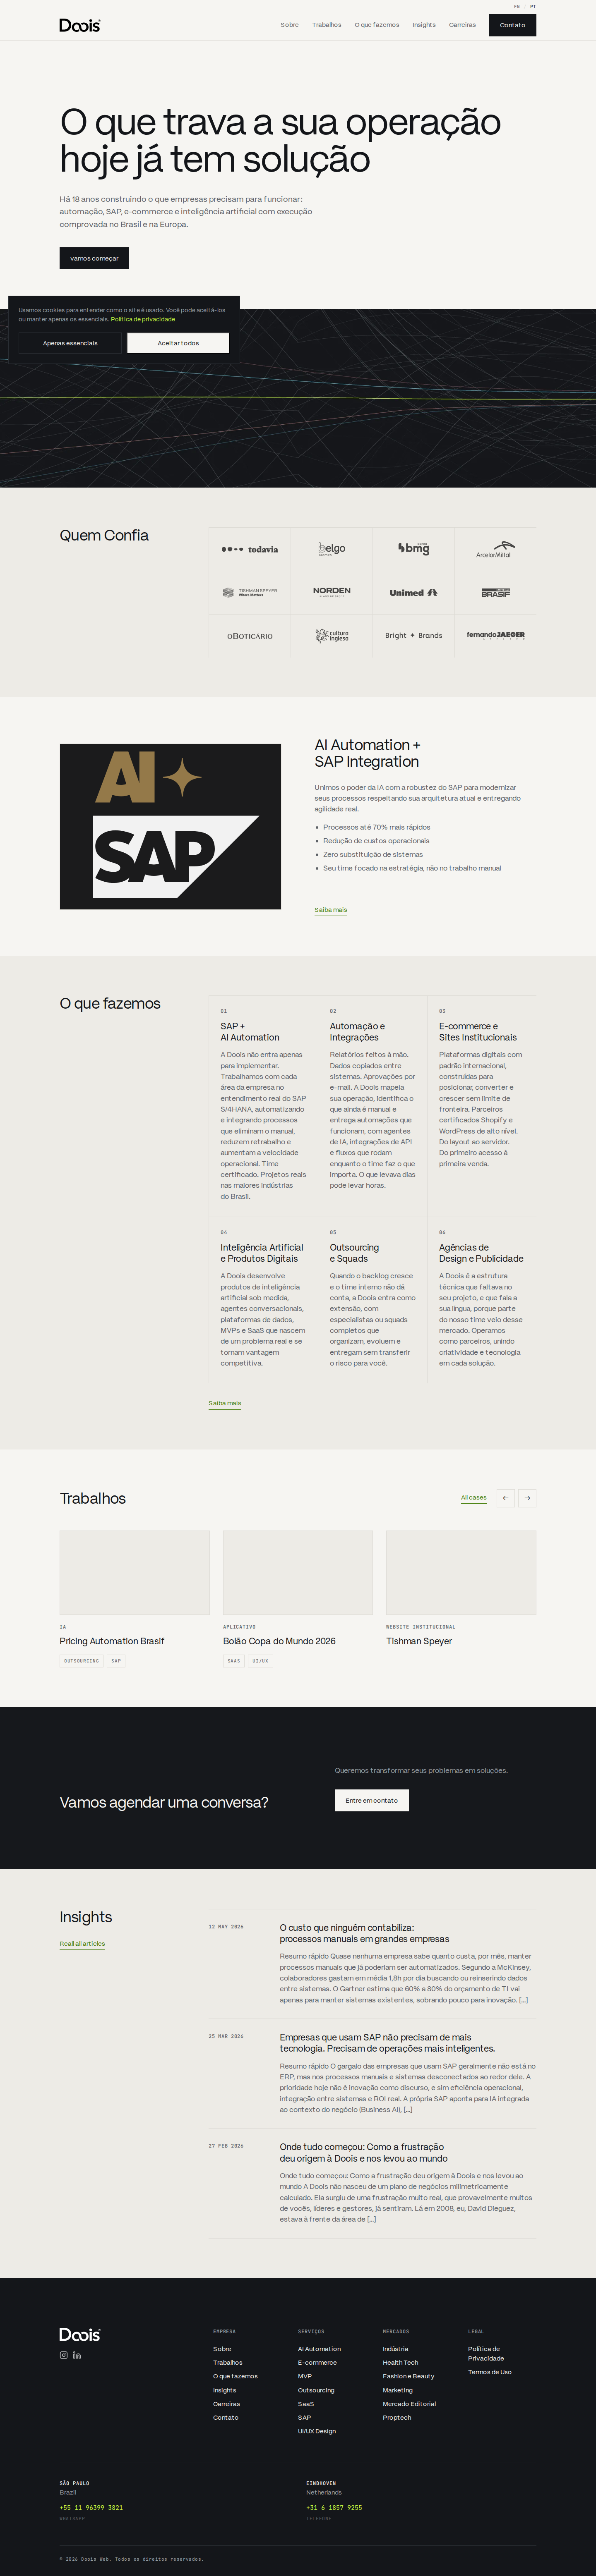
/ Doois | SAP, Automação de Processos e IA para Grandes Empresas 32 findings
https://doo.is · HTTP 200 · via seed

| Severity | Module | Finding | Recommendation |
|---|---|---|---|
| high | accessibility | Elements must meet minimum color contrast ratio thresholds Ensure the contrast between foreground and background colors meets WCAG 2 AA minimum contrast ratio thresholds |
https://dequeuniversity.com/rules/axe/4.12/color-contrast?application=axeAPI |
| high | accessibility | Links must be distinguishable without relying on color Ensure links are distinguished from surrounding text in a way that does not rely on color |
https://dequeuniversity.com/rules/axe/4.12/link-in-text-block?application=axeAPI |
| high | lighthouse | Max Potential First Input Delay The maximum potential First Input Delay that your users could experience is the duration of the longest task. [Learn more about the Maximum Potential First Input Delay metric](https://developer.chrome.com/docs/lighthouse/performance/lighthouse-max-potential-fid/). |
See the Lighthouse audit reference for remediation. |
| high | lighthouse | Time to Interactive Time to Interactive is the amount of time it takes for the page to become fully interactive. [Learn more about the Time to Interactive metric](https://developer.chrome.com/docs/lighthouse/performance/interactive/). |
See the Lighthouse audit reference for remediation. |
| high | lighthouse | Avoid multiple page redirects Redirects introduce additional delays before the page can be loaded. [Learn how to avoid page redirects](https://developer.chrome.com/docs/lighthouse/performance/redirects/). |
See the Lighthouse audit reference for remediation. |
| high | lighthouse | Minimize main-thread work Consider reducing the time spent parsing, compiling and executing JS. You may find delivering smaller JS payloads helps with this. [Learn how to minimize main-thread work](https://developer.chrome.com/docs/lighthouse/performance/mainthread-work-breakdown/) |
See the Lighthouse audit reference for remediation. |
| high | lighthouse | Reduce JavaScript execution time Consider reducing the time spent parsing, compiling, and executing JS. You may find delivering smaller JS payloads helps with this. [Learn how to reduce Javascript execution time](https://developer.chrome.com/docs/lighthouse/performance/bootup-time/). |
See the Lighthouse audit reference for remediation. |
| high | lighthouse | Background and foreground colors do not have a sufficient contrast ratio. Low-contrast text is difficult or impossible for many users to read. [Learn how to provide sufficient color contrast](https://dequeuniversity.com/rules/axe/4.12/color-contrast). |
See the Lighthouse audit reference for remediation. |
| high | lighthouse | Issues were logged in the `Issues` panel in Chrome Devtools Issues logged to the `Issues` panel in Chrome Devtools indicate unresolved problems. They can come from network request failures, insufficient security controls, and other browser concerns. Open up the Issues panel in Chrome DevTools for more details on each issue. |
See the Lighthouse audit reference for remediation. |
| high | lighthouse | Links do not have descriptive text Descriptive link text helps search engines understand your content. [Learn how to make links more accessible](https://developer.chrome.com/docs/lighthouse/seo/link-text/). |
See the Lighthouse audit reference for remediation. |
| high | lighthouse | Document request latency Your first network request is the most important. [Reduce its latency](https://developer.chrome.com/docs/performance/insights/document-latency) by avoiding redirects, ensuring a fast server response, and enabling text compression. |
See the Lighthouse audit reference for remediation. |
| high | lighthouse | Network dependency tree [Avoid chaining critical requests](https://developer.chrome.com/docs/performance/insights/network-dependency-tree) by reducing the length of chains, reducing the download size of resources, or deferring the download of unnecessary resources to improve page load. |
See the Lighthouse audit reference for remediation. |
| high | lighthouse | Render-blocking requests Requests are blocking the page's initial render, which may delay LCP. [Deferring or inlining](https://developer.chrome.com/docs/performance/insights/render-blocking) can move these network requests out of the critical path. |
See the Lighthouse audit reference for remediation. |
| medium | lighthouse | First Contentful Paint First Contentful Paint marks the time at which the first text or image is painted. [Learn more about the First Contentful Paint metric](https://developer.chrome.com/docs/lighthouse/performance/first-contentful-paint/). |
See the Lighthouse audit reference for remediation. |
| medium | lighthouse | Largest Contentful Paint Largest Contentful Paint marks the time at which the largest text or image is painted. [Learn more about the Largest Contentful Paint metric](https://developer.chrome.com/docs/lighthouse/performance/lighthouse-largest-contentful-paint/) |
See the Lighthouse audit reference for remediation. |
| medium | lighthouse | Speed Index Speed Index shows how quickly the contents of a page are visibly populated. [Learn more about the Speed Index metric](https://developer.chrome.com/docs/lighthouse/performance/speed-index/). |
See the Lighthouse audit reference for remediation. |
| medium | lighthouse | Total Blocking Time Sum of all time periods between FCP and Time to Interactive, when task length exceeded 50ms, expressed in milliseconds. [Learn more about the Total Blocking Time metric](https://developer.chrome.com/docs/lighthouse/performance/lighthouse-total-blocking-time/). |
See the Lighthouse audit reference for remediation. |
| medium | lighthouse | Image elements do not have explicit `width` and `height` Set an explicit width and height on image elements to reduce layout shifts and improve CLS. [Learn how to set image dimensions](https://web.dev/articles/optimize-cls#images_without_dimensions) |
See the Lighthouse audit reference for remediation. |
| medium | lighthouse | Minify CSS Minifying CSS files can reduce network payload sizes. [Learn how to minify CSS](https://developer.chrome.com/docs/lighthouse/performance/unminified-css/). |
See the Lighthouse audit reference for remediation. |
| medium | lighthouse | Minify JavaScript Minifying JavaScript files can reduce payload sizes and script parse time. [Learn how to minify JavaScript](https://developer.chrome.com/docs/lighthouse/performance/unminified-javascript/). |
See the Lighthouse audit reference for remediation. |
| medium | lighthouse | Reduce unused CSS Reduce unused rules from stylesheets and defer CSS not used for above-the-fold content to decrease bytes consumed by network activity. [Learn how to reduce unused CSS](https://developer.chrome.com/docs/lighthouse/performance/unused-css-rules/). |
See the Lighthouse audit reference for remediation. |
| medium | lighthouse | Reduce unused JavaScript Reduce unused JavaScript and defer loading scripts until they are required to decrease bytes consumed by network activity. [Learn how to reduce unused JavaScript](https://developer.chrome.com/docs/lighthouse/performance/unused-javascript/). |
See the Lighthouse audit reference for remediation. |
| medium | lighthouse | Use efficient cache lifetimes A long cache lifetime can speed up repeat visits to your page. [Learn more about caching](https://developer.chrome.com/docs/performance/insights/cache). |
See the Lighthouse audit reference for remediation. |
| medium | lighthouse | Improve image delivery Reducing the download time of images can improve the perceived load time of the page and LCP. [Learn more about optimizing image size](https://developer.chrome.com/docs/performance/insights/image-delivery) |
See the Lighthouse audit reference for remediation. |
| medium | lighthouse | Legacy JavaScript Polyfills and transforms enable older browsers to use new JavaScript features. However, many aren't necessary for modern browsers. Consider modifying your JavaScript build process to not transpile [Baseline](https://web.dev/articles/baseline-and-polyfills) features, unless you know you must support older browsers. [Learn why most sites can deploy ES6+ code without transpiling](https://developer.chrome.com/docs/performance/insights/legacy-javascript) |
See the Lighthouse audit reference for remediation. |
| medium | security | Missing Content-Security-Policy Missing `content-security-policy`. |
Add a CSP to mitigate XSS. |
| medium | security | Cookie missing HttpOnly flag(s) Session cookies should be Secure + HttpOnly + SameSite. |
Set the missing cookie flags. |
| low | markup | Duplicate id attributes Repeated ids: wonderpush-jssdk. |
Make every id unique. |
| low | markup | Cross-origin resources without SRI 7 external script/style without integrity. |
Add Subresource Integrity (integrity + crossorigin) to third-party scripts/styles. |
| low | privacy | Consent banner may lack a reject/manage option A cookie banner was detected but no reject/manage wording was found — consent should be as easy to refuse as to accept. |
Offer explicit "Reject"/"Manage" alongside "Accept". |
| low | security | Missing Permissions-Policy Missing `permissions-policy`. |
Restrict powerful features. |
| info | markup | No web app manifest No <link rel="manifest">. |
Add a manifest for installability/theming. |